


Think Your Market Is Huge? Calculate TAM, SAM & SOM Before Investors Do

 To calculate TAM SAM SOM, start by defining your product's total market using published industry data or a bottom-up customer count (TAM), then apply your real business constraints geography, channel, product scope to identify the segment you can actually serve (SAM), then estimate the share of that segment you can realistically capture in 1-3 years given your team size, budget, and conversion rates (SOM). The calculation requires two methods run in parallel top-down and bottom-up and the key quality check is whether both methods produce numbers within the same order of magnitude. If they diverge by 10x, your assumptions need reworking before the numbers go into a pitch or a plan. For the complete guide on what TAM, SAM, and SOM mean and how to use them in a pitch deck, TAM SAM SOM: formula, calculation and real examples covers the full guide.
What TAM, SAM, and SOM Each Measure
The three metrics are not interchangeable approximations of "market size." They answer three distinct questions, and understanding the distinction is the foundation of credible market sizing.
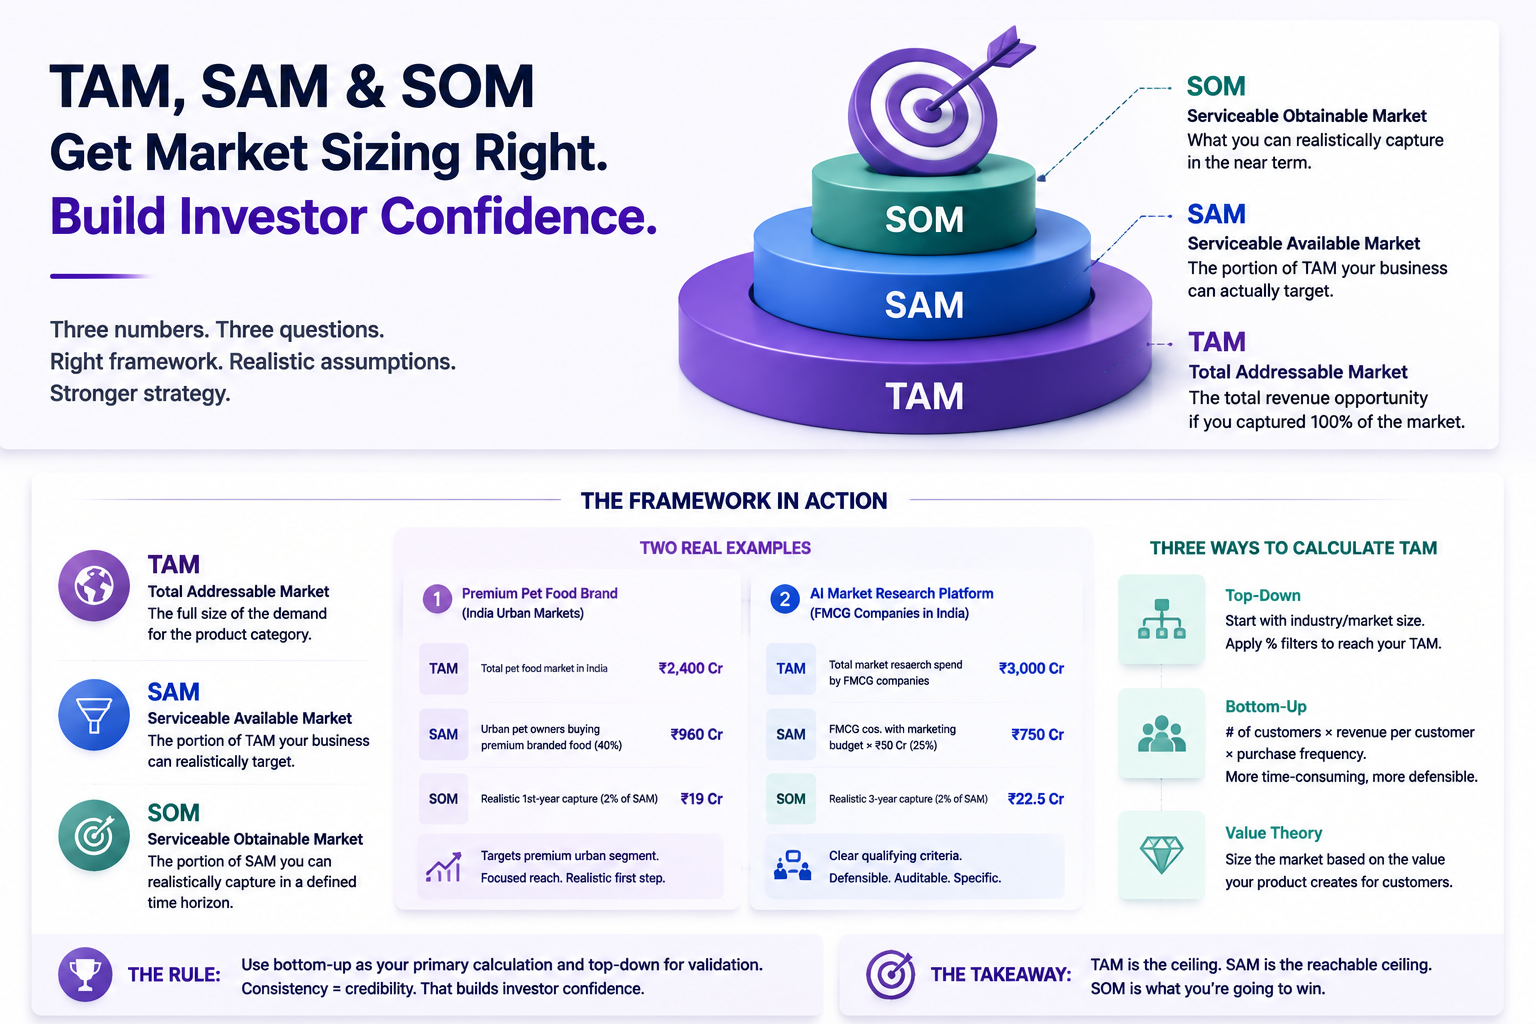
TAM Total Addressable Market is the total annual revenue opportunity available if a business captured 100% of its target market. No constraint on geography, competition, or capability. It represents the full size of the demand for the product category.
SAM Serviceable Available Market is the portion of TAM that a specific business can realistically target given its current product, geography, distribution, and go-to-market capability. SAM is TAM filtered by what the business model can actually reach.
SOM Serviceable Obtainable Market is the portion of SAM the business can realistically capture within a defined time horizon, accounting for competition, sales capacity, and market penetration rate. SOM is the realistic near-term revenue target.
The relationship in one line: TAM is the ceiling. SAM is the reachable ceiling. SOM is what you're actually going to win.
For a detailed breakdown of how TAM, SAM, and SOM differ in practice and why getting the distinctions wrong damages your pitch, the comparison guide covers the full practical picture.
Two Real Examples That Show How the Framework Works
Abstract definitions only go so far. Here is how the framework plays out against specific Indian market contexts.
Example 1: A Premium Pet Food Brand Targeting Indian Urban Markets
TAM: Total annual spend on pet food in India approximately ₹2,400 crore and growing.
SAM: Urban pet owners who purchase branded, premium pet food approximately 40% of the total market, or ₹960 crore. The brand targets premium positioning that is irrelevant to rural or value-segment buyers, so those segments are excluded from SAM.
SOM: Realistic first-year revenue capture 2% of SAM, or approximately ₹19 crore. Based on distribution reach limited to 8 major metro cities and a 6-month launch timeline.
What the numbers reveal: The TAM-to-SAM filter is doing real work here. A brand that presented its TAM as ₹2,400 crore without filtering to the premium urban segment would be misrepresenting the addressable market. The SAM of ₹960 crore is the honest number the pool the business is actually competing in. The SOM of ₹19 crore is the honest commitment specific enough to be audited against the distribution plan.
Example 2: An AI-Powered Market Research Platform Targeting Indian FMCG Brand Teams
TAM: Total annual spend on market research by FMCG companies in India approximately ₹3,000 crore.
SAM: FMCG companies with annual marketing budgets above ₹50 crore that are actively investing in consumer insights — approximately 25% of total research spend, or ₹750 crore. Smaller FMCG players who don't have formalised research budgets are excluded.
SOM: Realistic first-three-year revenue capture 3% of SAM, or approximately ₹22.5 crore. Based on current sales team capacity and product capability at launch.
What the numbers reveal: The SAM filter here is built on a specific qualifying criterion marketing budget threshold which makes it both defensible and auditable. An investor can challenge the 25% assumption and the founder can defend it with data on FMCG company distribution in India. That is exactly the kind of conversation market sizing should generate.
Three Ways to Calculate TAM and When to Use Each
Top-down calculation. Start with a large market size statistic total industry revenue, total consumer spend and apply percentage filters to narrow to the target market. Fast to produce. Most dependent on the quality of the starting data source. An investor will ask where the top-line number came from, and "a Statista report" is a weaker answer than "RBI household spend data filtered to urban categories."
Bottom-up calculation. Start with the number of potential customers, multiply by average revenue per customer, and build to total market size. More time-intensive. More defensible, because every assumption is explicit and auditable. A bottom-up TAM built on specific customer count estimates, a specific price point, and a specific purchase frequency is significantly more credible in a pitch context than one derived from industry reports.
Value theory calculation. Size the market based on the value the product creates for customers, not on current category spending. Most appropriate for genuinely new product categories where no existing market size data exists. If the product eliminates a cost or saves a resource that can be quantified, that quantification becomes the per-customer TAM input.
For a detailed practical guide to all the market sizing methods and when each is appropriate, including worked examples across each approach, the market sizing methods guide covers the full toolkit.
The rule that applies regardless of method: use bottom-up as your primary calculation and top-down for validation. A bottom-up number that is broadly consistent with a top-down industry estimate is a credible number. A bottom-up number that is dramatically inconsistent with top-down data has a wrong assumption somewhere that needs to be found before the pitch.
What Investors Are Actually Looking At
Most founders spend the majority of their preparation time on TAM the biggest number, the easiest to inflate. Investors spend the majority of their scrutiny on SOM the smallest number, the hardest to defend honestly.
The reason is straightforward. TAM validates that the market is large enough to matter. SAM validates that the business has a coherent targeting strategy. But SOM is the number that connects market opportunity to financial projection and the gap between SAM and SOM tells the investor everything about whether the team understands its own execution constraints.
Three things make a SOM credible:
Specific bottom-up assumptions. A SOM derived from "we will capture 3% of our SAM" is a percentage applied to a market. A SOM derived from "our current sales team of four can close 48 deals per year at an average deal value of ₹25 lakh" is a revenue commitment derived from operational reality. Investors know the difference, and they respond to it differently.
Internal consistency between SOM and the financial model. If the revenue projections in the financial model imply a Year 1 SOM of ₹30 crore, but the market sizing slide shows a bottom-up SOM of ₹10 crore, the inconsistency will be caught. The market sizing slide and the financial projections should tell the same story.
A realistic SAM-to-SOM ratio. For early-stage businesses, SOM should typically represent 1–5% of SAM in the first one to two years. A SOM that is 20% of SAM at launch requires extraordinary justification a captive distribution channel, a monopoly position, or a pre-existing customer commitment. Without that justification, it reads as optimism rather than analysis.
For the full guide to calculating SOM specifically the method, the formula, and what investors look for, the dedicated SOM guide covers the complete picture.
Why TAM, SAM, and SOM Matter Beyond the Pitch Deck
These three metrics are not just investor communication tools. They are strategic planning inputs that should govern real decisions inside the business.
TAM informs product investment decisions. Is the addressable market large enough to justify the development cost? A TAM that seems large in absolute terms may be too small for the revenue required to justify a venture-scale investment.
SAM defines the go-to-market boundary. Which customer segments, geographies, and channels is the business genuinely competing in? The SAM definition should directly drive where sales and marketing resources are allocated.
SOM sets the near-term resource plan. What sales capacity, what distribution reach, and what conversion rate does the business need to achieve its SOM? Working backwards from SOM to operational requirements is how resource planning stays grounded in market reality rather than aspiration.
Teams that revisit their TAM, SAM, and SOM assumptions regularly rather than locking them in at the pitch stage and not updating them are better equipped to catch when the market context has changed and when the original assumptions no longer hold. For tools and methods to keep market sizing current as the business evolves, the guide to market sizing tools for startups and marketers covers the practical data sources.
Frequently Asked Questions
1.What is the difference between TAM, SAM, and SOM?
TAM is the total market opportunity without constraint the full demand for the product category. SAM is the portion the business can realistically target given its current model, geography, and distribution. SOM is the portion it can realistically capture in a defined timeframe given competition and capacity. TAM is the ceiling. SAM is the reachable ceiling. SOM is what the business will actually win.
2.How do you calculate TAM?
Three approaches: top-down (start with a large market statistic and apply filters), bottom-up (multiply potential customers by average revenue per customer), or value theory (size the market by the value the product creates rather than current spending). Bottom-up is more defensible for investor presentations because every assumption is explicit and auditable.
3.How do you calculate SAM from TAM?
By applying filters that reflect the realistic reach of the business model the specific customer segments it can serve, the geographies it operates in, and the price points it addresses. SAM = TAM × (relevant customer segment %) × (addressable geography %) × (accessible price tier %).
4.What percentage of SAM should SOM be?
For early-stage businesses, 1–5% of SAM in the first one to two years is the credible range. SOM above 10% of SAM at launch requires specific justification a captive distribution channel, pre-existing customer commitments, or a demonstrably exceptional go-to-market engine.
5.Why do investors focus more on SOM than TAM?
Because SOM connects market opportunity to financial projection. TAM validates that the market is large enough to matter. SOM determines whether the financial projections are achievable with the proposed resources. Investors know that most large-TAM businesses fail not because the market was too small but because the SOM assumptions were unrealistic.
6.Should TAM, SAM, and SOM be updated after the initial pitch?
Yes. Market sizing is not a one-time exercise. As the business scales, the distribution reach expands, the product capability deepens, and the competitive landscape shifts all of which change the SAM and SOM. Teams that treat their original market sizing as fixed often discover they are operating on outdated assumptions that no longer reflect the current market context.
Market sizing is most useful when it is honest when the TAM is filtered to what is genuinely addressable, the SAM reflects the realistic reach of the current model, and the SOM is grounded in specific operational assumptions rather than applied percentages. Pulse AI Research helps brands and founders build market sizing frameworks grounded in consumer research connecting category intelligence to the bottom-up assumptions that make each number credible.
Must Reads: what is TAM, what is SAM, what is SOM, how to calculate TAM SAM SOM
Read Similar Blogs
Read Similar Blogs
10 Market Research Techniques That Actually Deliver InsightsMarket Research Steps: A Practical Framework for Brand Teams Who Need...Consumer Research Process: A Step-by-Step Workflow for Better InsightsConsumer Insights Data: From Evidence to Brand ActionContingency Question in Surveys (Skip Logic Guide)How to Create a Survey Questionnaire That Delivers Reliable ResultsDifference Between Research Method and Research Methodology: Clearing Up the...Where Market Research Is Headed: Trends Brands Can’t IgnoreHypothesis Testing in Research Methodology: A Practical GuideQualitative Research Questions: How to Ask Better Questions for Deeper Consumer...Qualitative Consumer Research: Why Customers Behave This WayExploratory Research Design: When and How to Use ItBrand Health vs Brand Equity: Key Metrics and DecisionsConsumer Research Methodology: A Step-by-Step GuideConfusing Survey Questions: 25 Examples and How to Fix ThemWhy Customers Buy: Consumer Behaviour Insights for BrandsObjectives of Marketing Research: The Real DistinctionQuestionnaire Answer Choices (2026): How to Write Options That Improve Data...Quantitative vs Qualitative Consumer Research: Which One?Consumer Insights Platform: What It Is and How to Choose One
10 Market Research Techniques That Actually Deliver InsightsMarket Research Steps: A Practical Framework for Brand Teams Who Need...Consumer Research Process: A Step-by-Step Workflow for Better InsightsConsumer Insights Data: From Evidence to Brand ActionContingency Question in Surveys (Skip Logic Guide)How to Create a Survey Questionnaire That Delivers Reliable ResultsDifference Between Research Method and Research Methodology: Clearing Up...Where Market Research Is Headed: Trends Brands Can’t IgnoreHypothesis Testing in Research Methodology: A Practical GuideQualitative Research Questions: How to Ask Better Questions for Deeper...Qualitative Consumer Research: Why Customers Behave This WayExploratory Research Design: When and How to Use ItBrand Health vs Brand Equity: Key Metrics and DecisionsConsumer Research Methodology: A Step-by-Step GuideConfusing Survey Questions: 25 Examples and How to Fix ThemWhy Customers Buy: Consumer Behaviour Insights for BrandsObjectives of Marketing Research: The Real DistinctionQuestionnaire Answer Choices (2026): How to Write Options That Improve...Quantitative vs Qualitative Consumer Research: Which One?Consumer Insights Platform: What It Is and How to Choose One