
Matcha Consumer Behaviour in India: After the First Sip
Matcha Consumer Behaviour in India: What Happens After the First Sip Meta Title: Matcha Consumer Behaviour in India: After the First Sip Meta Description: How do young Indians actually behave around matcha? Survey data on trial, repeat use, café choice, friction and brand scepticism, with next steps for brands. Primary Keyword: matcha consumer behaviour Secondary Keywords: matcha consumption habits India, matcha trial to repeat, matcha café choice, why consumers drink matcha, matcha purchase barriers, matcha brand scepticism, young Indian consumers behaviour, consumer behaviour research methods Meta Keywords: matcha consumer behaviour, matcha consumer behaviour India, matcha consumption habits, matcha trial and repeat, matcha café preference, why people drink matcha, matcha barriers to purchase, matcha price perception, matcha health perception, matcha brand credibility, trend vs habit research, consumer funnel analysis, equal-price choice test, young Indian consumers, consumer insights for beverage brands Most conversations about matcha count how often it appears on menus and feeds. Matcha consumer behaviour is a different question: what do people actually do once they have tried it, and what do they do when the novelty fades? A trend can generate trial without generating loyalty, and brands that confuse the two over-invest in launches and under-invest in retention. PulseAI Research's survey of 18–35-year-olds across metro, Tier 1, Tier 2 and rural India lets us follow matcha through awareness, trial, current use, weekly use, café choice, perceived meaning and reaction to brand launches. This is a behavioural question, not a branding one, and it should be settled before a colour palette is chosen. This article reads the data as a sequence of behavioural moments, shows where the drop-offs sit, and explains how brands and researchers can use them to decide where to focus. Quick Answer Matcha consumer behaviour in India, among young matcha-familiar consumers, looks more like routine than curiosity. Most people who try matcha keep drinking it, almost half drink it weekly, and it beat every other café drink in an equal-price test. The biggest drop-off happens between current use and weekly use, which is where retention work should focus. Consumers also judge brands: many welcome matcha launches, but nearly a third spot trend-chasing. Trial converts well: 78.3% have tried matcha and 67.5% currently drink it. The sharpest drop is at habit: 47.6% drink weekly or more, roughly 20 percentage points below current use (derived). Choice holds without price: 50% picked matcha when every café drink cost the same. Motivation is layered: health leads (50.6%), then aesthetic (38.0%) and premium (30.7%). Price is the main brake: "expensive" (22.3%) outranks "bitter" (10.8%) and "overhyped" (10.2%). Credibility is judged: 30.1% say a Matcha Edition can feel forced. Matcha Consumer Behaviour at a Glance Behavioural moment What the survey shows What it suggests Decision it informs Trying 88.3% aware, 78.3% tried Awareness converts to trial easily Less need for pure awareness spend Repeating 67.5% current, 47.6% weekly+ Habit formation is the harder step Retention, formats, pricing Choosing 50.0% matcha vs 24.1% cold coffee at equal price Preference exists beyond price Menu mix and placement Believing 50.6% healthy, 38.0% aesthetic Two motives work together Message hierarchy Judging 61.4% curious, 30.1% sceptical Brands are tested for credibility Launch go/no-go Source: PulseAI Research consumer survey of 18–35-year-olds familiar with matcha. "Suggests" and "Decision" columns are interpretation. Moment One: The Funnel Shows Where Matcha Behaviour Leaks Here is the funnel as reported: 88.3% aware, 78.3% tried, 67.5% currently drink, 47.6% drink weekly or more. Reading the gaps between stages is more useful than reading the stages themselves. These ratios are derived from the percentages above, assuming they share the same base: Aware to tried: about 89% of aware consumers have tried it. Tried to current: about 86% of triers still drink it. Current to weekly: about 71% of current drinkers drink weekly or more. Trial is not the problem. Roughly one in nine respondents (10.8 percentage points) has tried matcha but doesn't currently drink it, and the larger opportunity sits among occasional drinkers who haven't made it a weekly habit. What a brand can learn: more trial offers won't fix an occasional-drinker problem. Habit-building levers like ready-to-drink formats, loyalty hooks and everyday price points matter more. What a researcher should do: segment current drinkers by frequency and ask what would move them up one step. Decision it can improve: whether to spend on acquisition or on frequency. Moment Two: What Consumers Choose When Price Is Removed Price confounds almost every beverage preference question. PulseAI Research's choice test removed it by pricing every café drink the same. Matcha or a matcha latte took 50.0%, cold coffee 24.1%, smoothie/juice 6.6%, chai/tea 6.0%, hot coffee 4.8%, bubble tea 4.8%. Plain green tea took 1.8%. Two things stand out. Matcha gets roughly twice the share of its nearest rival. And green tea barely registers, which suggests (this is interpretation, not a survey finding) that consumers may treat matcha as a café experience rather than as a type of tea. What a brand can learn: matcha competes for the café occasion, so its benchmark is cold coffee, not tea. What a researcher should do: repeat the test at real prices. The gap between equal-price and real-price choice measures how much preference depends on cost. Decision it can improve: menu mix and where matcha sits in pricing architecture. Why People Drink Matcha: Three Layers of Motivation Understanding matcha consumer behaviour means understanding why people choose it. Associations fall into three groups: Wellness and function: healthy (50.6%), natural (28.9%), calm (24.1%), wellness (19.3%). Culture and desire: aesthetic (38.0%), premium (30.7%), trendy (25.9%), Japanese (22.9%). Friction: expensive (22.3%), bitter (10.8%), overhyped (10.2%). Health is the entry point, but the drink also carries social and visual meaning. Matcha lets consumers do something that feels good and looks current at once, which is a rarer combination than either alone. Note the self-reported nature of this data. People may describe matcha as healthy because that is the socially accepted reason, so pair association data with behavioural measures like frequency and choice. Decision it can improve: which motive to lead with in communication, and which to support. What Holds Matcha Back: Price, Taste and Hype Barriers are smaller than motivations but they shape who stays and who doesn't. The largest, at 22.3%, is that matcha feels expensive. Bitterness (10.8%) and being overhyped (10.2%) follow. These are three different problems with three different fixes: Price: test smaller pack sizes, sampling and entry-level formats. Taste: test sweetness levels and milk-forward recipes to soften first-time bitterness. Hype fatigue: avoid over-claiming. Consumers who feel the category is overhyped will be harder to win with louder messaging. Decision it can improve: where to invest to convert occasional drinkers into weekly ones. When Behaviour Travels Beyond the Cup Matcha's meaning is also changing what consumers want from other categories. Interest in matcha-inspired products was highest for skincare (71.1%) and fitness/wellness (53.0%), then fragrance (39.8%), home/lifestyle (36.1%) and makeup/nails (31.9%). Watches/accessories (21.7%) and clothes (21.1%) ranked lowest, and 8.4% were interested in none. The ranking follows meaning. Categories that share matcha's health and natural associations score highest, while categories that borrow mostly the colour score lowest. This suggests consumers extend a drink's meaning, not its shade. What a brand can learn: a matcha extension is easier to justify when it inherits a real association. Decision it can improve: which adjacent category deserves a concept test first. How Consumers Judge Brands That Use Matcha When asked about brands launching a "Matcha Edition", 61.4% were curious, visually drawn or trend-led, 8.4% were indifferent, and 30.1% said it can feel trend-following or forced. That is a behavioural warning: the same audience that enjoys matcha also audits brands for credibility. A launch can attract attention and still lose trust if the product doesn't explain why matcha belongs. What a researcher should do: include a "does this feel forced?" measure in every concept test, alongside appeal and purchase intent. Decision it can improve: go/no-go on limited editions. Colour as a Behavioural Trigger PulseAI Research tested six creatives, only two of which named matcha. All six scored between 73.1% and 86.2% on appeal. The top two, at 86.2% each, were a fragrance and a watch creative, and neither mentioned matcha. This suggests that for this audience, colour, mood and styling can trigger the association without the word. Appeal is a screening signal, though, not a sales forecast. Always follow it with believability and intent measures. Decision it can improve: whether packaging and campaign visuals should name matcha or simply signal it. How to Research Matcha Consumer Behaviour: A Five-Step Approach PulseAI Research's study design offers a useful template for any team studying a trend: Screen the audience. Use category familiarity as the gateway, and define who the findings represent. Map the behaviour. Measure awareness, trial, current use, frequency and café preference. Decode the meaning. Ask what the category represents, including positive, aspirational and friction associations. Test the stretch. Measure interest in adjacent categories and reaction to brand launches. Put the visuals to the test. Test creatives with and without the category name. A Worked Example This is a hypothetical scenario to illustrate how the survey findings could be applied. It is not a real company or real results. Business problem: A regional café chain sees steady matcha latte sales but doesn't know whether to give matcha a permanent menu slot or keep it as a seasonal special. Research approach: The team surveys its own customers aged 18–35. It measures trial, current use and weekly use, then runs an equal-price choice test followed by a real-price test. It also asks about barriers such as price, bitterness and hype. What the data could show: Many customers have tried matcha, but weekly use is much lower than current use. The equal-price test favours matcha strongly, but the lead narrows at real prices. Price is the main barrier cited. Insight: Preference is real but price-sensitive, and the gap is in frequency, not trial. Business action: The chain keeps matcha permanent, adds a smaller, lower-priced size, and runs a frequency-based loyalty offer instead of another trial promotion. Expected outcome: More weekly drinkers over time. The team would track repeat rate by cohort, not only total matcha sales. PulseAI Research Insight The most common mistake with a trend like matcha is measuring attention and calling it behaviour. Social buzz and launch-week sales tell you people noticed. They don't tell you whether people repeat, switch, or quietly drop off. What businesses often get wrong: They stop at trial and skip frequency. They treat all positive reactions as one group, missing the sceptical third. They assume a trend-led product needs a trend-led message, when the survey suggests meaning and credibility do more work. How consumer research improves the decision: the sequence Research → Consumer Understanding → Insights → Faster Decisions → Business Action works best here when behaviour (what they do), meaning (why), friction (what stops them) and credibility (what they believe) are measured together. Each one on its own can mislead. What brands should pay attention to next: whether weekly use grows or plateaus, and whether "overhyped" and "expensive" associations rise as the category gets crowded. A one-off survey is a snapshot, and tracking is what shows whether a habit is forming. What brands should measure: frequency, not just trial; price sensitivity; believability of launches. What researchers should investigate: differences by city tier, age and gender; reasons for lapsing among those who tried but don't currently drink. What decision the insight can improve: whether to invest in acquisition, retention, or a credible extension. FAQs What is matcha consumer behaviour? It covers how consumers discover, try, repeat, choose and judge matcha, along with the meanings and barriers that shape those actions. In PulseAI Research's survey, it spans awareness, trial, weekly use, café choice, associations and reactions to brand launches. It helps brands see whether matcha is a habit or a passing trend. How often do young Indians drink matcha? In PulseAI Research's survey of matcha-familiar 18–35-year-olds, 67.5% currently drink matcha and 47.6% drink it weekly or more. These figures describe an audience that already knows matcha, so they shouldn't be applied to the whole population or used directly for market sizing. Why do consumers choose matcha over other café drinks? Health is the top association (50.6%), followed by aesthetic and premium cues. In an equal-price test, matcha took 50.0% against 24.1% for cold coffee, so preference isn't driven by price alone. Self-reported reasons should be paired with behavioural data before drawing firm conclusions. What stops people from drinking matcha more often? The survey's main friction points are cost (22.3%), bitterness (10.8%) and feeling it is overhyped (10.2%). Each calls for a different response: smaller formats or sampling for price, recipe testing for taste, and restrained messaging for hype. Researchers should ask lapsed and occasional drinkers directly. How do you measure matcha consumer behaviour? Combine a behavioural funnel (awareness, trial, current and weekly use), equal-price and real-price choice tests, association mapping, barrier questions and creative testing. Using behaviour and perception together avoids over-reading appeal. For ongoing decisions, repeat the study over time to track movement. What is the difference between consumer behaviour and consumer trends? A trend describes what is visible and popular. Behaviour describes what people repeatedly do and why. A matcha trend might appear in menus and feeds, while behaviour shows up in frequency, choice under constraints and willingness to pay. Brands need both, but investment decisions should lean on behaviour. Related Concepts India's Protein Pulse Plates, Preferences & Power Clean Is India Still a Biscuit-Loving Nation? The Indian Gut Feel
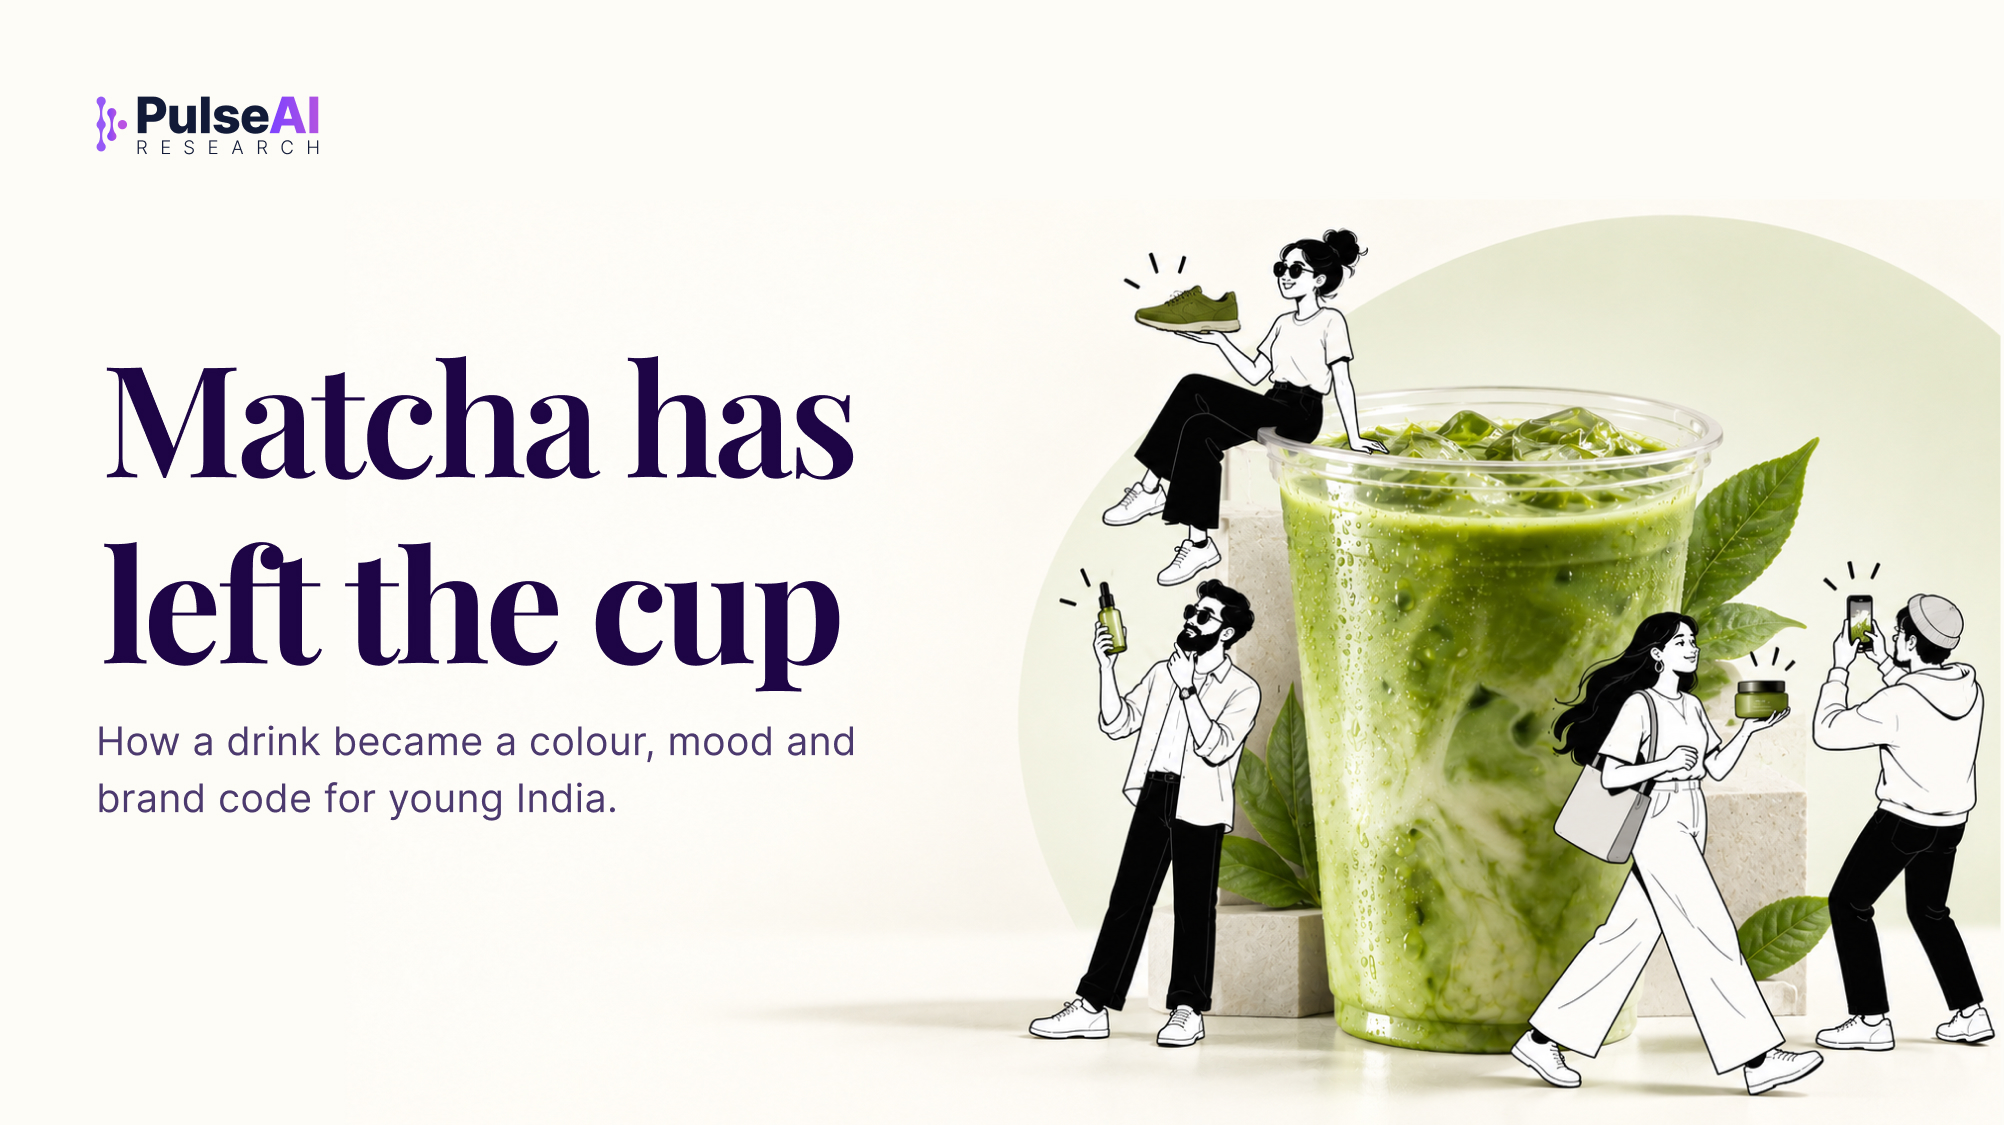
Matcha Trend in India: 5 Consumer Signals Brands Should Act On
Is the matcha trend in India a fad or a habit? PulseAI Research survey data on consumption, meaning, skincare extensions and credible launches.

Customer Feedback Surveys: How to Get Actionable Insights (Templates + Examples)
Design better customer feedback surveys: set objectives, write strong questions, run online surveys, and analyze results to turn responses into actionable customer insights. Includes table + FAQs.

Is Your Brand Really Growing? 7 Brand Tracking Research Strategies to Find Out
Learn effective strategies for brand tracking research, from market research design and competitive analysis to behavioral signals, reporting, and action planning.

Why Market Research Matters More Than Ever in 2026
Discover why market research is important in strategic planning. Analyze consumer behavior to make informed decisions that connect business ambition with market reality.

The Complete Guide to Consumer Insights in 2026
Learn what consumer insights are, how they differ from market research and market insights, and how to turn customer data into practical business decisions.

7 Trends Redefining Market Research Strategy in 2026
Discover the latest trends in market research, including AI-driven insights, continuous research systems, and privacy-first strategies, to enhance your strategy for 2026.

Customer Survey Questions That Actually Get Answers: 50+ Examples for Every Journey Stage
Copy-paste 50+ survey questions for customers across purchase, onboarding, usage, support, renewal, and churn plus best practices to improve response rates and get actionable feedback.
Designing Effective Standardised Questionnaires for Surveys
Learn how to create a standardised questionnaire with clear objectives, unbiased survey questions, consistent response options, pilot testing, and practical design tips.